Capture and analyze network traces in Azure App Service for Linux
Troubleshooting network issues in Azure App Service for Linux has traditionally required several manual steps. You would typically SSH into your app, run a packet capture from the container, download the resulting trace, and then open it in a tool such as Wireshark to investigate what happened.
We’re making that workflow much easier with a new Network Capture experience, now available in preview.
You can collect network traces directly from Kudu or the Azure CLI. And instead of stopping at packet capture, you can optionally have the trace automatically analyzed to generate a report that highlights potential problems and summarizes what happened during the capture.
Note: Before starting a network capture, make sure the app container is up and running.
Capture a network trace from Kudu
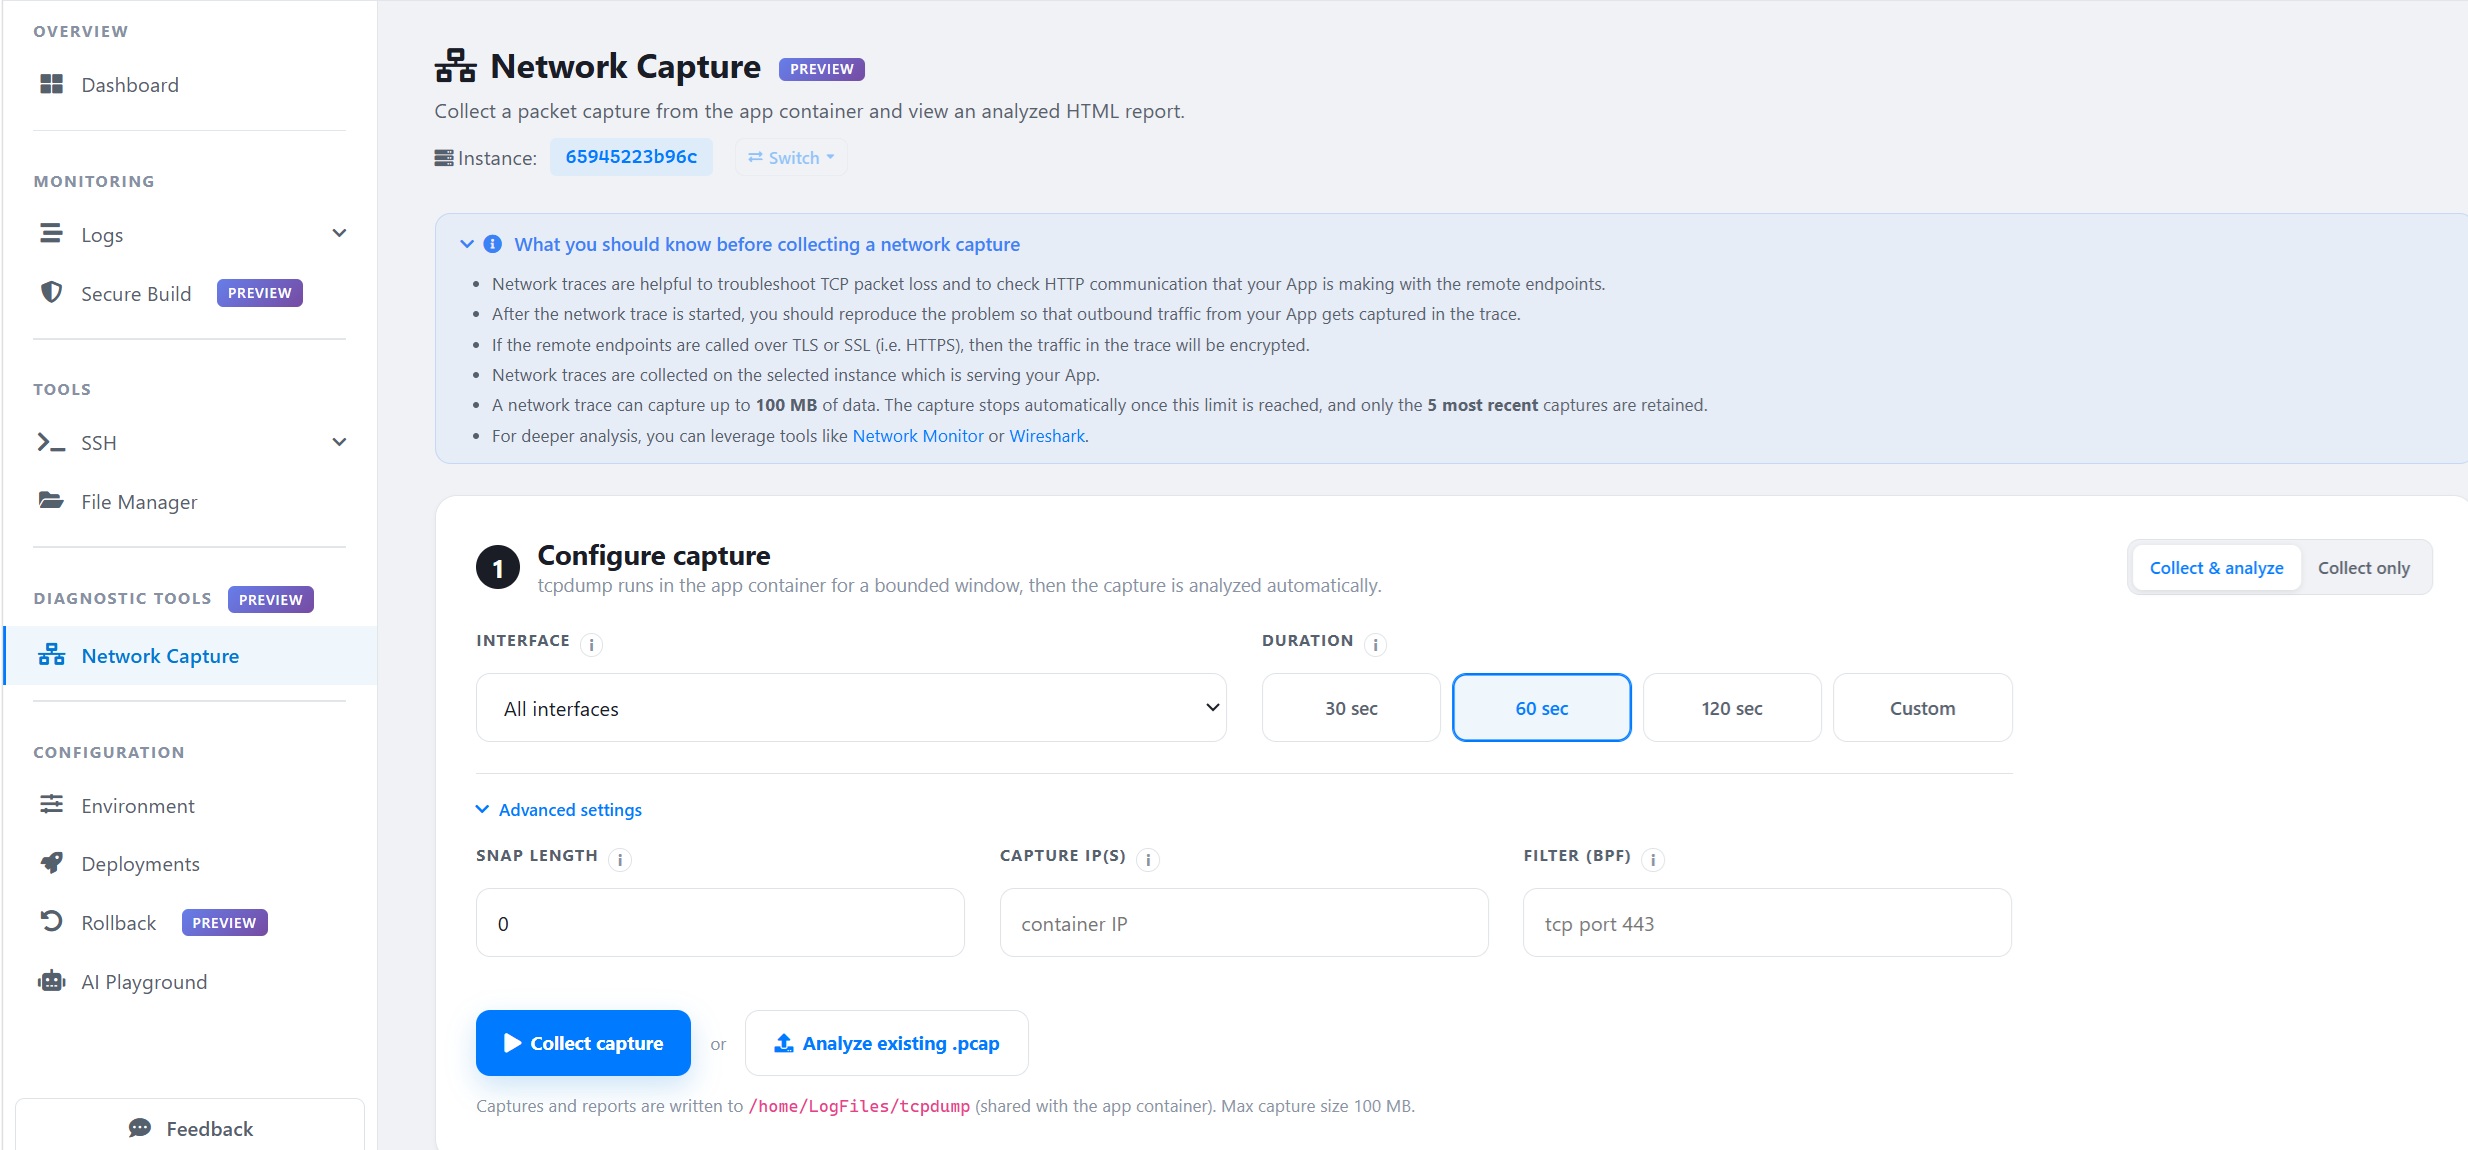
In Kudu, go to Diagnostic Tools > Network Capture.
Select the App Service instance where you want to collect the trace, and configure the capture. You can select the network interface and capture duration, with preset options for 30, 60, and 120 seconds or a custom duration.
For more targeted troubleshooting, advanced settings let you configure options such as:
- Snap length
- Capture IP address
- BPF filter, for example
tcp port 443
You can then choose between two modes:
Collect & analyze captures the network trace and automatically generates an analysis report.
Collect only captures the trace without running the built-in analysis, so you can download the .pcap file and inspect it using a tool such as Wireshark.
You can also use Analyze existing .pcap if you already have a packet capture that you want to inspect using the built-in analyzer.
A few things to keep in mind when collecting a trace:
- Network traces are collected on the selected App Service instance serving your app.
- If your app communicates with remote endpoints over TLS or SSL, including HTTPS, the traffic in the trace will be encrypted.
- A network trace can capture up to 100 MB of data. The capture stops automatically when this limit is reached.
- Only the five most recent captures are retained.
After collection, your captures appear in Capture history, where you can view the generated report, download the .pcap file, or delete the capture.
Capture network traces from the Azure CLI
You can also collect network traces without opening Kudu by using the Azure CLI.
For example, to collect a packet capture without running automatic analysis:
az webapp troubleshoot collect network-capture \
    -g <resource-group> \
    -n <capture-name> \
    --instance $instance \
    --duration 10 \
    --collect-only
To collect the trace and run the built-in analysis:
az webapp troubleshoot collect network-capture \
    -g <resource-group> \
    -n <capture-name> \
    --duration 10
This makes it easier to use network capture as part of your normal command-line troubleshooting workflow, without first connecting to the container over SSH.
Make sure you’re using the latest version of the Azure CLI.
Go from packet capture to useful insights
Capturing the packets is often only the first part of troubleshooting. The harder part is figuring out which packets matter and what they tell you about the problem.
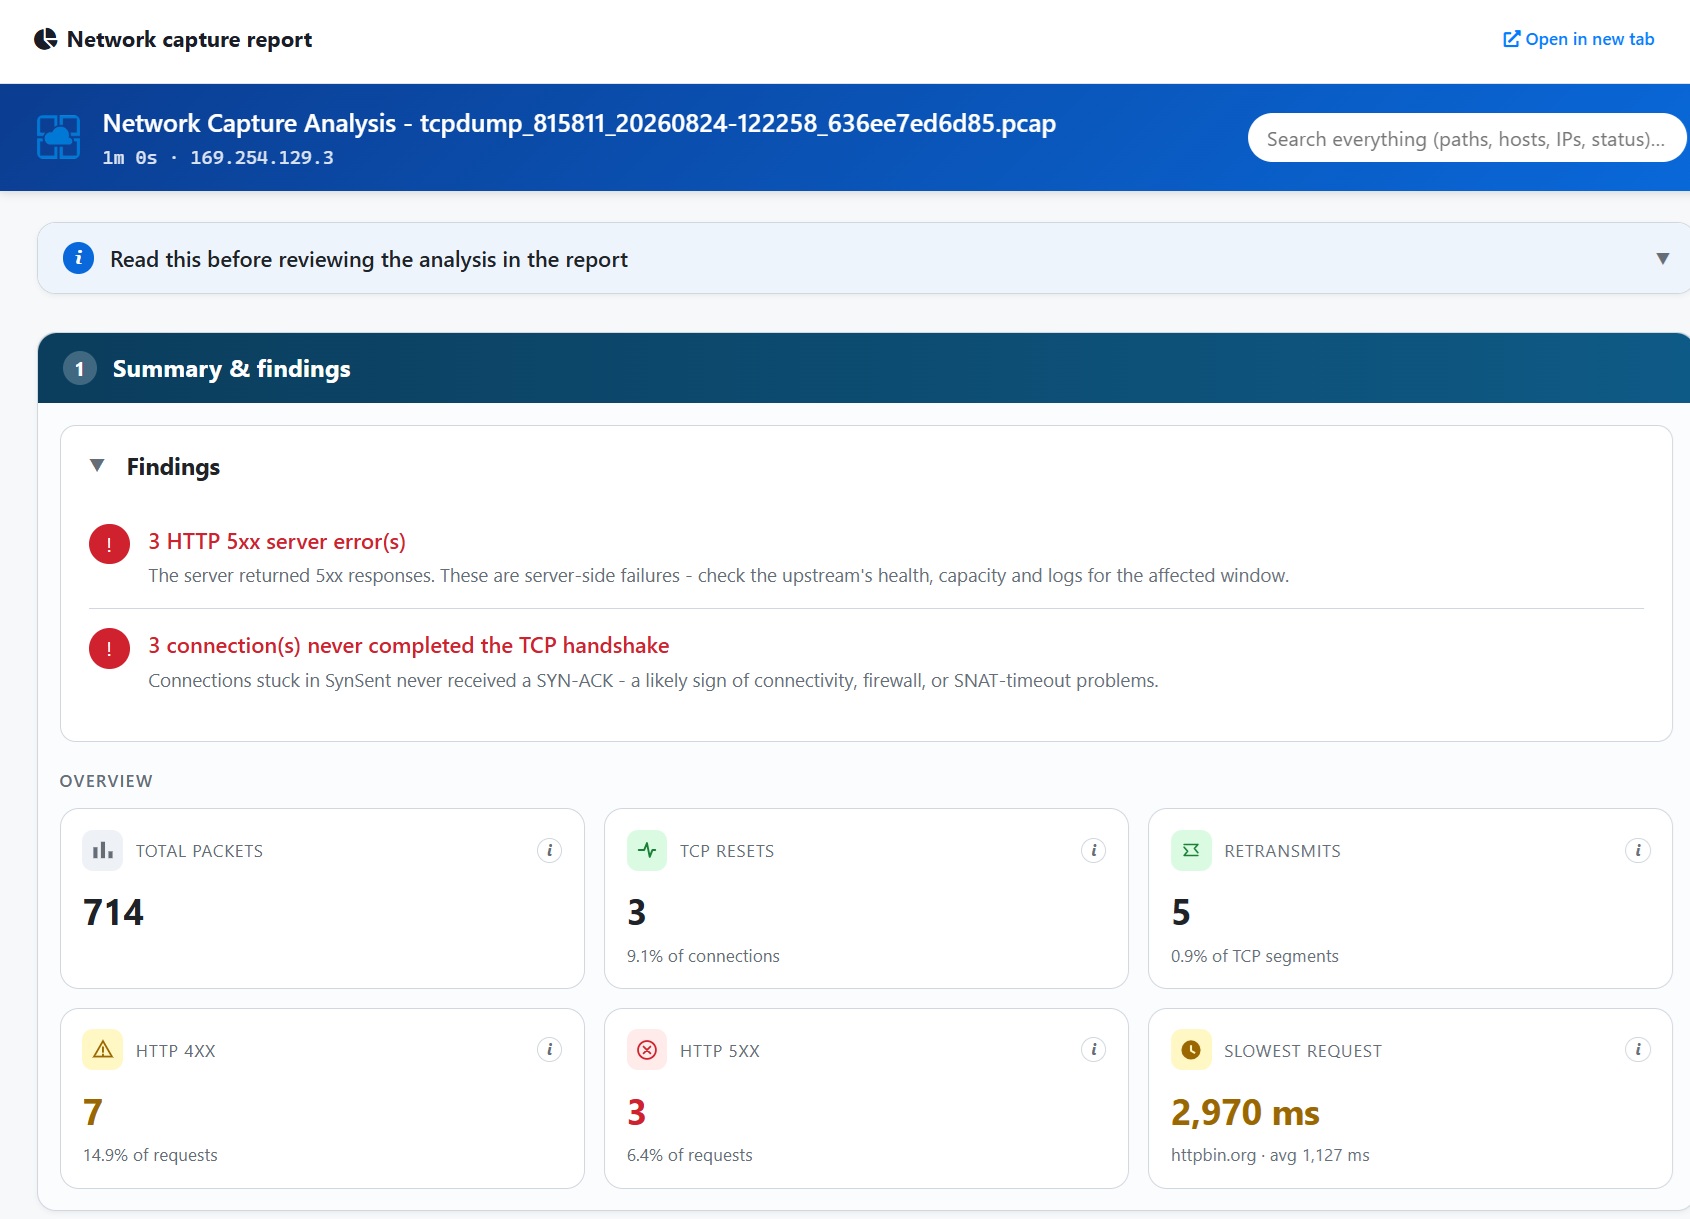
When you choose to collect and analyze a trace, Network Capture does some of that work for you. It processes the trace and generates a report that summarizes the traffic and highlights findings that may warrant further investigation.
For example, the report can identify:
- HTTP 5xx responses
- Connections that did not complete the TCP handshake
- TCP resets
- Retransmissions
- HTTP 4xx and 5xx request rates
- Slow HTTP requests
The report also provides context for some findings. For example, connections that remain in SynSent and never receive a SYN-ACK can point to connectivity, firewall, or SNAT-related problems.
Instead of starting with hundreds or thousands of individual packets, you get a quick view of where to begin your investigation.
Understand what happened during the capture
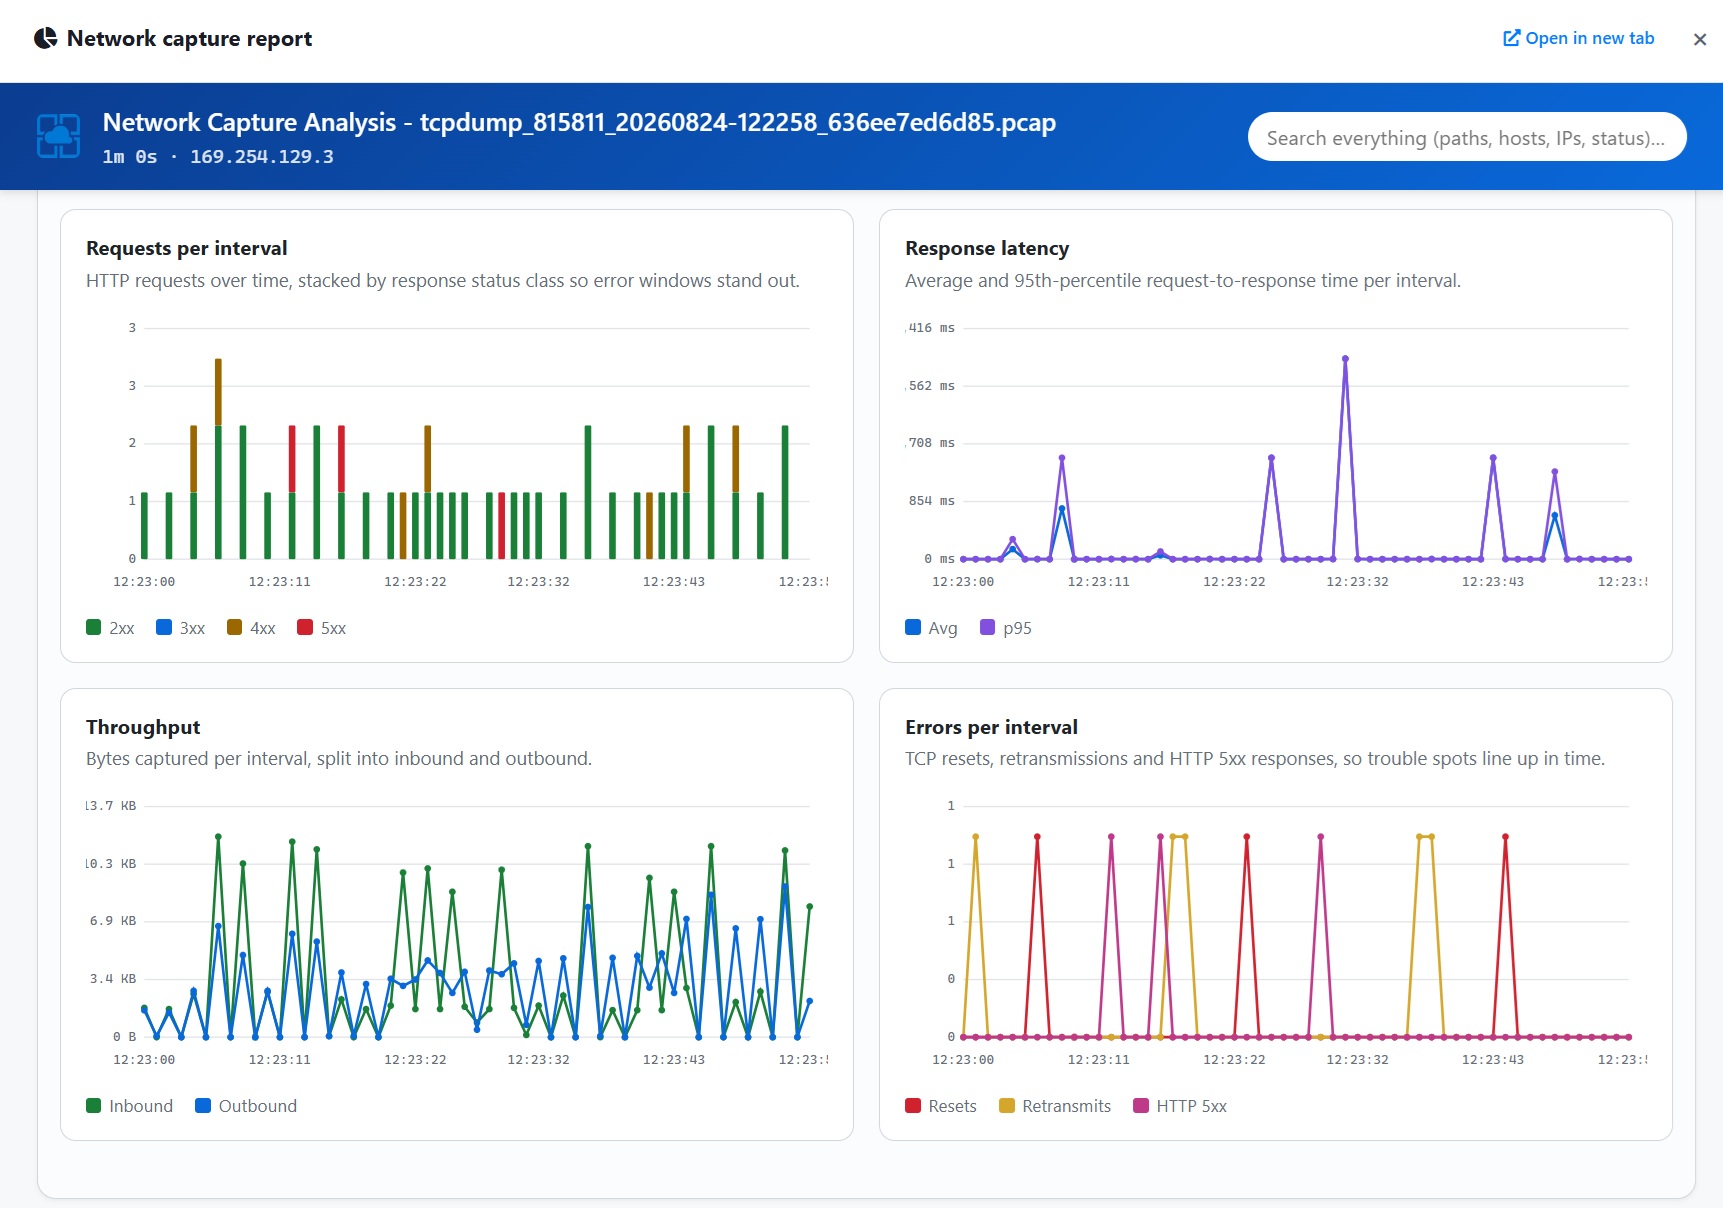
The report also provides visualizations that help you understand network behavior across the capture window.
Requests over time
See HTTP requests over time, grouped by response status class.
This makes it easier to identify periods where 4xx or 5xx responses occurred and correlate them with other network activity.
Response latency
View average and 95th-percentile request-to-response latency over time.
This can help highlight latency spikes and narrow down the part of the capture that needs further investigation.
Throughput
See inbound and outbound traffic during the capture window.
This provides a quick view of traffic patterns and periods of higher or lower network activity.
Errors over time
TCP resets, retransmissions, and HTTP 5xx responses are shown on the same timeline, making it easier to see when different network symptoms occur together.
Capture limits
Network captures are intentionally bounded so they can be collected safely from a running app.
| Setting | Limit |
|---|---|
| Maximum capture duration | 300 seconds |
| Maximum capture size | 100 MB |
| Snap length | 0, or 64–65535 bytes |
| Capture history | 5 most recent captures |
A snap length of 0 captures the entire packet, which is needed when you want the analyzer to fully decode unencrypted HTTP traffic. Positive snap-length values are constrained to the supported range.
The requested capture duration is capped at 300 seconds, and collection also stops automatically if the trace reaches the 100 MB size limit first.
Try Network Capture
The Network Capture experience is currently in preview for Azure App Service for Linux.
If you’re troubleshooting connectivity failures, HTTP errors, latency, retransmissions, or other network-related issues, you can now collect the trace directly from Kudu or the Azure CLI.
And when you want a quicker starting point than examining the raw .pcap, use the built-in analysis to surface potential problems, latency patterns, throughput, errors, and other useful signals from the trace.
Give it a try and let us know what you think. We’d especially like feedback on the automated analysis: which findings are useful today, and what other network problems would you like the report to help identify?
